Avoiding the Pitfalls of Performance Metrics
The intended audience for this article is a leader who wants to measure and improve the performance of people, and is considering quantitative metrics, targets and goals to do so. Quantitative metrics are powerful tools. But when applied to human work, they can easily cause lasting and deep damage. This article’s purpose is to help the reader be able to identify and avoid their pitfalls, and deploy them usefully.
I was inspired to write this article after reading the books The Delicate Art of Bureaucracy by Mark Schwartz and The Tyranny of Metrics by Jerry Muller. While I draw from these and many other sources, I do think I have a novel mental model for thinking about the pitfalls of metrics and avoiding them.
In a previous blog article, I wrote how great CTOs use metrics judiciously to measure the health of a technology function and to drive change. I grossly understated the potential problems with using metrics. I implied it is easy to get them right. They are not. Hence this article amplifies on the topic.
Definitions

For clarity, I will be using some terms with the following meanings:
- Data are units of information collected through observation. They are both numeric and non-numeric. E.g.: employee sentiment (“I feel dissatisfied”) is a non-numeric datum; an estimate of the quantity of work done (“tickets closed last week”) is a numeric datum.
- A metric is numerical data intended to measure something. Some data is already numeric and therefore a metric. Converting employee sentiment to a score between 1 and 5 would turn non-numeric data into a metric. On their own, metrics are devoid of judgment. E.g.: an agile software development team practicing Scrum finds its sprint velocity to be 40. By itself, this metric is neither good nor bad.
- A target is some value for a metric that is considered desirable. Desire creates judgment. E.g.: the manager of the agile team decides that the sprint velocity should be higher and sets a target of 45. Now, values below 45 are bad, and above 45 are good.
- A goal is a target with consequences. E.g.: the engineering manager of several teams sets a goal of achieving a sprint velocity of 45. He/she says that a team that exceeds this goal will be rewarded and a team that doesn’t meet the goal will have penalties imposed on them. Now the target is a goal. Target and goal are often used interchangeably but I use the term goal to emphasize the presence of consequences.
- An outcome is a qualitative expression of desired state. E.g.: the outcome for a software development team could be “in 2021, deliver these features …., while maintaining software quality, i.e., reliability, security, and performance”. Goals (should) serve outcomes.
- How do individuals perceive the relative importance of meeting goals versus meeting the underlying outcomes? I will define a goal as high-stakes if meeting the goal is perceived to be more important than the outcomes. E.g.: our agile team decides to increase their sprint velocity but compromises on reliability and security. They’ve met the goal but not the outcome. I will define a goal as low-stakes if meeting it is perceived to less important than delivering the outcome. E.g.: the team perceives that quality is dropping; they negotiate the outcome with management and lower sprint velocity to increase quality; they are not penalized by management. Here, the team focused on the total outcome (features plus quality) instead of a goal that was supposed to serve it but did not.
- A metric is more accurate than another if its value is a better representation of the reality that a metric is supposed to represent. A metric is more precise than another if it is more exact, or, would evaluate to the same value consistently when measured multiple times. A metric can be more precise, accurate, both or neither than alternatives.
Why Use Metrics?

Metrics, targets and goals are often created without a discussion of why they are needed. The same metric may be created because of different motivations which impact how they are perceived and used. It is incorrect to assume they will always result in good outcomes. If you know the likely motive for a metric, you will be better positioned to ask if it will serve you well.
| Destructive Motives | Productive Motives |
|---|---|
| 1. To Copy Smart People | 6. To Inform and Motivate |
| 2. To Wish Complexity Away | 7. To Explore and Discover |
| 3. To Replace Human Judgment | |
| 4. To Assert Control | |
| 5. To Systematize |
1. Destructive Motive: To Appear Smart (by Copying Smart People)
When decision makers are faced with uncertainty and complexity, they look for guidance on how to run their organizations well. Many business and management consultants advise us to use metrics. Some pieces of advice have become dictums. They seem to provide simple, absolute guidance on how to improve things and get things done. Decision makers feel confident that they are doing something right by adopting these adages.
However, these adages are not what they seem: they are often incomplete or downright misunderstood. Let’s look at a few.
“If you can’t measure it, you can’t improve it.”
The above saying is mis-attributed to Lord Kelvin. More reliably, it seems what Lord Kelvin actually wrote was:
I often say that when you can measure what you are speaking about, and express it in numbers, you know something about it; but when you cannot measure it, when you cannot express it in numbers, your knowledge is of a meagre and unsatisfactory kind; it may be the beginning of knowledge, but you have scarcely in your thoughts advanced to the state of Science, whatever the matter may be.
— Lord Kelvin, PLA, vol. 1, “Electrical Units of Measurement”
First, Kelvin was writing about electrical phenomena. Electrons don’t change their behavior if we quantify it with numbers. People do. When deploying a metric, have we accounted for how it will change behavior? Second, Kelvin did not say there is no knowledge without numbers, but that numerical measurement brings more knowledge. Measurement has a cost. Is the extra knowledge always more valuable than the cost? In human systems, this may not be true.
“What gets measured, gets managed.”
The above saying is sometimes attributed to Peter Drucker, the great management guru (1, 2). Some people say there’s no evidence that Drucker actually ever said this (3) and are not sure Drucker would agree with this statement.
Moreover, the statement is incomplete. The journalist Simon Caulkin wrote (highlights mine):
If there’s one management platitude that should have been throttled at birth, it’s ‘what gets measured gets managed’. It’s not that it’s not true—it is— but it is often misunderstood, with disastrous consequences.
The full proposition is: ‘What gets measured gets managed - even when it’s pointless to measure and manage it, and even if it harms the purpose of the organisation to do so.’
“What gets measured, gets done.”
This is attributed to Tom Peters, a management consultant, from 1986. The source of this seems reliable, coming as it does from the author’s own website. First, if true, is this actually beneficial? Consider my expansion: “only what gets measured gets done, and therefore things that are not measured, even if they are important, tend not to get done.” Second, is this true? Maybe. It could be a self-fulfilling prophecy. Consider an organization where people are doing many kinds of important work, measured or not. The saying does not apply today. A set of leaders start measuring some kinds of work, and rewarding people for improvements on only those kinds of work. Soon, employees decide that un-measured work is not worth doing and stop doing it. The saying applies now. Prophecy fulfilled. This situation can happen because people change their behavior when said behavior is measured.
Takeaway. Don’t try to appear smart by copying. Don’t use metrics just because someone supposedly said so. Understand where they come from.
2. Destructive Motive: To Wish Complexity Away
Consider these situations:
- A new external leader has just joined a large organization, with many functions, products, geographies, and/or market segments;
- An internal leader leading one group has been promoted to lead a collection of groups consisting of multiple functions or geographies.
Leaders are tasked with improving the performance of the collection of groups under their supervision. The challenge is that each group creates different kinds of value, using different inputs, outputs and processes. Even similar groups have nuances. Groups doing the same function in different geographies work differently. Co-located groups which seem to have the same mission and function (e.g., different application development teams) use different terminology and value different things.
How is a leader to improve the performance of many very different groups? The leader can treat each of them uniquely and try to understand their context and the value they bring deeply, and follow their work in their context. This requires time and effort. The complexity seems overwhelming and progress seems frustratingly slow.
It seems easier to (a) create standard metrics that measure something that is common across groups, (b) impose them across the groups, (c) use them to measure and compare the performance of groups, and then (d) set goals for these metrics to improve performance.
However, as I will show below, standardized metrics lose a lot of context. They will not reduce complexity of circumstances. Therefore they are frequently a bad fit for some groups. In fact, they may be a bad fit for all groups. How bad? I will explore this later.
Takeaway. Check if the motivation behind implementing metrics is to wish complexity away, and resist standardization if this is true. If you really want to standardize, then do it the way GM’s NUMMI plant did by adopting Toyota’s Lean Manufacturing principles. This is significantly more work than imposing standard metrics and goals, but the results can be stellar.
3. Destructive Motive: To Replace Human Judgment
Human judgment is subject to biases. If people are asked to judge how well they are doing, they are very likely to over-estimate their performance. When asked to judge how well someone else is doing, confirmation bias, recency bias and just plain old misunderstanding will introduce errors in their judgement. Good judgment is a learnt skill, takes time, is not available everywhere, and even when available is subject to errors. Metrics are objective, or so we think. Hence, decision makers are tempted to use metrics to replace human judgement for measuring performance.
In some cases, metrics may be needed to defend or establish the credibility of human judgment. One example is the situation I described in the section “Money Talks! Talk Money!” in my previous blog article. There, metrics are required to overcome distrust or, put another way, to increase trust. But they don’t replace judgment.
Generally, it is better to establish trust via understanding and not via abstract metrics. Metrics should be used as a high-level tool that prompts investigations, and not be a judgment by themselves. The reason is that the data entry for metrics, their collection, aggregation, reporting and interpretation all require human judgment, which as we said earlier, can be flawed.
Takeaway. If you are thinking of establishing metrics because you distrust what people are telling you qualitatively, consider if some training in probability estimation and decision making is a better option. The book How to Measure Anything and Thinking in Bets are good starting points. This will take a lot more initial investment of time and effort than implementing metrics but will improve the organization in a lasting way.
4. Destructive Motive: To Assert Control
Sometimes, stakeholders believe they are not getting their investment’s worth from a particular function. If the function is of a specialist nature, working by its own rules, stakeholders are unable to influence its inner workings significantly. This frustrates them. They then use metrics and targets to assert control, manifested via rewards and punishments tied to metrics.
We can see this in the increasing legislation and regulation attempting to tie practitioners’ pay to performance in the fields of healthcare and education in the US. In the past, performance was judged qualitatively, but the new legislation mandates that performance be measured quantitatively. These measures have been controversial because metric-based performance evaluation and corresponding funding/pay has not had a clear positive impact on outcomes, and there have been unintended side effects (such as greatly increased administrative burden and cost, gaming of metrics and demoralization). For more details and references, see The Tyranny of Metrics by Jerry Muller.
The logic behind pay-for-performance, where performance is largely or wholly evaluated by metrics, is compelling. Why has it not worked as well as hoped? Taking a step back, both education and healthcare are only a part of a complex web of socio-economic phenomena. They do not have complete control of the outcomes. Using quantitative measures of outcomes as the sole yardstick of people’s performance is problematic because there are many other factors at play.
Takeaway. Outcome based metrics and targets on a function cannot improve outcomes greatly when the functions are only in partial control of the outcomes. Additionally, stricter controls incentivize the function’s best performers to leave, and the rest to try and game the metrics, dropping the impact on real outcomes even further.
5. Destructive Motive: To Systematize (Everything)
As organizations become larger, decision makers get further away from the action, and members of the organization do work of greater diversity. Decision makers find it harder to drive the organization in the direction they want. Complexity strikes, again. How does one improve performance, then? The approach taken by the decision makers depends on their mental model of an organization.
All models are, to an extent, wrong, but some are useful. Models are wrong to the extent that they are a simplification and leave some details out in favor of keeping other details in. Hopefully, the details left out are irrelevant for the purposes the model was intended for.
One model of organizations is that they are are a hierarchy of systems and sub-systems. Such a hierarchy can be systematized. Top-level outcomes can be set and a cascading hierarchy of goals and sub-goals can be used to drive a large organization towards delivering those outcomes. This philosophy is described in the book Measure What Matters by investor John Doerr. He writes how he described his “proven approach to operating excellence: Objectives and Key Results” to the founders of Google (highlights mine):
In this goal-setting system, objectives define what we seek to achieve; key results are how those top-priority goals will be attained with specific, measurable actions within a set time frame. Everyone’s goals, from entry level to CEO, are transparent to the entire organization.
(As prize pupil Marissa Mayer would say, “It’s not a key result unless it has a number.”) You either meet a key result’s requirements or you don’t; there is no gray area, no room for doubt.
This model is attractive. The whole organization works towards achieving a few, well-defined objectives (or outcomes). Key results define milestone against those objectives. Metrics tell us whether we have achieved a key result, or not, with perfect clarity. What details has the model left out? Some are: (a) sub-systems interact with each other across boundaries, creating feedback loops leading to surprising effects; (b) some outcomes are important but not captured at the top-level, and it is assumed they will be met regardless (e.g., complying with the law while trying to meet goals); (c) that the objectives are complete and account for the novel (e.g., somehow innovation will occur within the framework of goals). How important are these details?
An alternative model of organizations is that they are like a biological system, composed of complex networks that “constantly reconfigure themselves”: i.e., they are complex, adaptive systems (CAS) (Schwartz, The Art of Business Value). Agile and DevOps movements are consistent with this model: instead of hard goals tracked via metrics, the organization’s various groups still try to achieve the organization’s objectives, but they (or their managers) define “fitness” parameters and then evolve their processes to improve their fitness. Here, metrics may be used by the groups themselves to determine how fit they are and in which direction to exert effort.
If management persists with the idea that systematization is the only good way to run an organization, they will expand the scope of systematization to cover more and more aspects of the organization. In his book, The Delicate Art of Bureaucracy, Mark Schwartz writes (paraphrasing another author):
Although Google became famous for its “20% time,” by which employees were encouraged to spend one day a week working on new ideas outside their normal tasks, that time is now increasingly subject to audit and performance measurement, and their ideas must be entered into a shared database.
Does this version of “20% time” feel like time that is meant for people to feel free and be creative?
Takeaway. Before you go down the path of attempting to make every aspect of an organization systematized, consider whether this approach will lead to the destruction of the ability of the organization to adapt to changing business circumstances in order to deliver objectives.
6. Productive Motive: To Inform and Motivate
Organizations undertake changes to improve some outcome. People resist change. One common objection is that the change won’t improve the outcome significantly or at all. By implementing metrics to measure the outcome, getting some progressive groups to implement change, leaders can determine if their hypothesis is true. If the impact on outcomes is positive, then by widely sharing the results, leaders can convince conservative groups to adopt the changes. If the impact on outcomes is not positive, leaders can cut their losses and limit the cost of change. The value of metrics is to present information clearly.
For example, Peter Pronovost, a previous intensive care specialist physician and professor, concluded that a simple 5 item check-list protocol would reduce infections in a particular, common, medical procedure. Surgeons are not fans of checklists. Pronovost managed to convince a large group of hospitals to participate in 2003 to participate in what later came to be called the “Keystone Initiative”, and in 2006 reported that they were able to reduce infections up to 66%, and save an estimated 1500 lives and $100 million over 18 months. In 2008 Time named Pronovost one of the 100 most influential people in the world.
An important aspect of the initiative was that the participants did not just implement the new protocol, but used metrics. In the original 2006 paper on the initiative and in a follow-up 10-year analysis, Pronovost wrote (highlights mine):
In addition to the intervention … the ICUs implemented the use of a daily goals sheet to improve clinician-to-clinician communication within the ICU…
Active involvement of hospital leaders and the Keystone Center as well as ongoing monitoring and feedback of performance were important in sustaining results.
Daily goals sheets, ongoing monitoring, performance feedback… This sounds fairly regimental. However, Pronovost also wrote (highlights mine):
The Keystone ICU project demonstrated the potential of voluntary efforts that rely on intrinsic motivation through peer norms and professionalism.
If the physicians were participating voluntarily and had intrinsic motivation to reduce infection rates, why did the initiative need metrics? Pronovost’s interpretation is that the improvements came about primarily via:
a shift in clinicians’ belief—by showing them that the rate of infection was not inevitable and could be controlled, in a way that appealed to their professional ethos as doctors and nurses.
In other words, the metrics were used to inform and direct intrinsic motivation, not override it. The initiative did not just give clinicians a metric to improve; they were given training via ongoing calls and coaching, and data on which interventions seemed to be effective and which not, and so on. The initiative appealed to the existing motivation amongst doctors and nurses to provide good care for their patients, and then provided them with support to do so, including using metrics to show what worked and what did not.
7. Productive Motive: To Explore and Discover
Metrics can be used as data to inform decisions. David Selinger, founder and CEO of RichRelevance, and an ex-Amazon employee gives two examples. The first example is about improving something:
While I was at Amazon, my team proved (65 pages of proof, in fact!) the impact of website load times on sales, and identified the metrics that mattered. Without hesitation, Bezos and Amazon reorganized around a new, even more aggressive method of measuring website performance, changing hundreds of jobs to obsess about these very metrics.
The second example is about overcoming blind spots and biases:
Bezos had a rare ability to set opinions aside in favor of data. At Amazon, one of my proposals was to sell advertising on the homepage, and Bezos’s initial response wasn’t positive: “It is one of the stupidest ideas I’ve ever heard.” Yikes.
Nonetheless, when I showed data to prove the opportunity, I had approval. Bezos told me to run a live test, and from that simple decision we found a billion dollars.
Notice that this way of using metrics is quite different from the one espoused in the “Objectives and Key Results” (OKRs) approach. OKRs are top down and restrictive. What I described above, in Selinger’s words is (highlights mine):
an approach to business that institutionalizes the finding, questioning and testing of data … (it) requires that everyone, regardless of seniority, have access to data and tools to test their ideas and intuitions.
Caution: Selinger writes “More than anyone I’ve ever met, Bezos knew that things don’t improve unless they’re measured.” However, there is another side to it. Bezos also looks at real-life anecdotes and not only data:
The thing I have noticed is that when the anecdotes and the data disagree, the anecdotes are usually right. There is something wrong with the way that you are measuring it.
You do need the data, but then you need to check that data with your intuition and your instincts.
Is There A Problem? Yes: Metric Fixation.

At a high-level, problems occur when people think the only way to run an organization well is to use only metrics to measure performance, and to set goals against metrics to improve performance. I will call this phenomena metric fixation, borrowing from Jerry Muller’s book, The Tyranny of Metrics.
There are scholarly papers, books, and articles on the internet that talk about either a specific failure mode of metrics, or a unstructured laundry list of things that can go wrong. If getting metrics right is important, we should also have some confidence that we are not missing something. In other words, a structured and comprehensive approach. To think about problems with metrics in a structured way, here is a mental model:
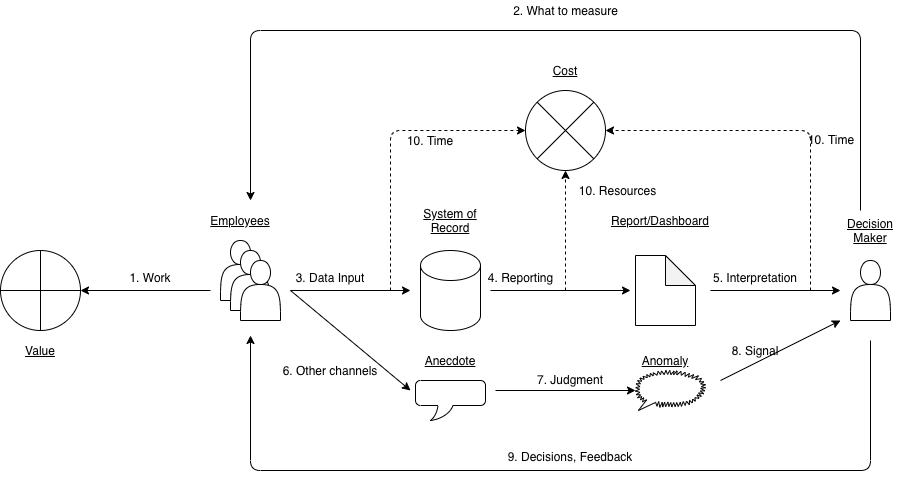
In this model:
- Employees do work, that produces some value.
- A decision maker needs to measure their performance. The decision maker tells employees what will be measured.
- Almost always, employees need to do some data entry for the measurement. A system of record and allied tooling is needed to capture the data.
- The data needs to be curated, aggregated and reported on.
- The decision maker looks at the reports and interprets the metrics.
- Employees bring unusual situations to attention via emails, calls, ad-hoc meetings, escalations, etc., outside the data entry system. This is not systematic data yet. Let’s call them “anecdotes”.
- Employees in a position to observe many anecdotes (middle managers), use their judgment to see if there are anomalies not captured via metrics, and if they do, send a “signal” to decision makers. An anomaly could be something going wrong, or an opportunity to potentially take advantage of.
- The decision maker needs to decide what to do with the signal, especially when it conflicts with metrics.
- Decision makers make decisions about what people should be doing. They also decide how groups and individuals are performing and give them feedback. The decisions and feedback lead to changes in the work being done, data being entered, and anecdotes being shared.
- While all this is going on, collecting data, reporting it, and discussing it involves some time and resources, incurring cost.
These processes are not linear but work as a feedback loop: one part affects another. Still, I have to start somewhere and work my way through the topics linearly, so I have chosen a path that seems to tell the most logical story.
Pitfalls in Deciding What to Measure
The pitfalls in deciding what to measure arise from the temptation to sacrifice accuracy over precision when a precise metric is easier to capture and report on than an accurate one.
In a business system, there are inputs: things we do and the resources we have; and there are outputs: things we produce that others can consume. Finally, there are outcomes: the desired results. Corresponding to each, we can have input metrics, output metrics and outcome metrics. Outcome metrics are the most desirable ones as they tell us if we are getting the results we want. However, usually input and output metrics are easier to measure and are used as proxies for outcomes. Sometime, they are used, in combination with outcome metrics, as leading indicators that tell us if we are going in the right direction before the outcomes are visible.
Input/output metrics are flawed to the extent of the uncertainty in whether an input or output will achieve an outcome; it is easy to forget this and start believing they are capable of telling the absolute and complete truth, leading to overuse and misuse.
Precise but Inaccurate Metrics
There is a strong tendency to prefer precise looking metrics even if their accuracy is low. This phenomenon has been satirized as the Streetlight Effect:
A policeman sees a drunk man searching for something under a streetlight and asks what the drunk has lost. He says he lost his keys and they both look under the streetlight together. After a few minutes the policeman asks if he is sure he lost them here, and the drunk replies, no, and that he lost them in the park. The policeman asks why he is searching here, and the drunk replies, “this is where the light is”.
Example. In my current role, my team and I regularly meet customers. The topics and purposes are diverse. One of the purposes is to advise customers on how to improve their system architecture to, say, increase reliability, performance and security, or reduce cost and operational burden. The inputs are our activities, viz., meetings we hold with customers and research we do in between meetings. The outputs are the solutions or recommendations we create for our customers. The outcomes are actual improvements in customers’ systems and the impact of those improvements. We find outcomes hard to measure. A customer may take weeks or months to implement our recommendations and my team members lack the time and resources to continuously follow-up with every customer. The impact itself may be hard to measure: how do you measure increased security via a metric? Outcomes are also not easily standardized. A recommendation that reduces the page load time of a website will have different kinds of value if it is for an e-commerce website (increased sales) vs an internal tool (increased staff productivity and satisfaction).
Hence, our functional group has adopted metrics that are much easier to measure: how many meetings we did that were “customer advisory engagements”. This metric can be easily standardized across teams: after all, we all do meet our customers. This metric is precise: we can simply count the number of records entered. The metric is a proxy for how much effort we are spending on advising our customers. From that point of view, the metric is inaccurate, as a meeting that took a lot of effort to prepare and run counts the same as a meeting that did not take any effort. Its correlation with outcomes is uncertain.
Notice that I wrote outcomes are “hard” to measure, not “impossible”. We can measure outcomes if we really wanted to. We could set more time aside to follow-up with customers, and get accurate though imprecise estimates for the value of increased reliability and security by using methods described in How to Measure Anything and Thinking in Bets. This would take time and co-operation from our customers and we would have to train them.
Avoiding the Pitfall. The best way to avoid this pitfall is to consciously prefer accurate metrics over less accurate ones and expending the time and effort to measure them. When this is not possible, use less accurate metrics but treat them with a pinch of salt. In my example, we do understand that our metric is not accurate and focusing on it over doing the right thing for customers would be participating in the Streetlight Effect.
Measuring Only Inputs and Outputs, Not Outcomes
This is a special case of the previous pitfall. Since outcomes are often hard to measure, organizations measure only inputs and outputs, and use them to judge performance. This is not a problem if the metrics and goals are treated with a pinch of salt and the organization focuses on outcomes, poorly measured though they may be. However, if the goals were to become high-stakes, resources would be diverted away from delivering outcomes to meeting goals, which are not the same thing.
Example. In many customer organizations that my group works with, software development teams run as autonomous agile teams working with product managers to decide what to build. The desired outcomes of such a team are multi-dimensional: (a) the work should lead to increase in revenue; (b) the software should meet the needs of end users and seek to delight them; (c) the system should be performant, reliable and secure; (d) the software should be easy to deploy, monitor, and troubleshoot; (e) it should be cost-effective. Most product managers therefore care only about their measurable output metrics: how many features are delivered. Product managers seldom prioritize work that improves reliability, operability and security because those aspects are hard to measure. As a result I find that organizations have systems that have the needed functionality, but with a lot of technical debt. Improvements to system architecture is undertaken only when there is a problem in production and an Engineering Manager or VP steps in to over-ride the product manager and prioritize the reduction of technical debt. By this time, much damage has already been done.
Avoiding the Pitfall. The first remedy is to insist on looking at all desired outcomes, even if they cannot be measured precisely, and consider them along with input and output metrics. If decision makers regularly consider outcomes as well as input/output metrics, the groups under them will be less likely to ignore the unmeasured but important outcomes. The second remedy is to create a culture of excellence, substituting the lack of outcome metrics with pride in one’s work. A technical team that understands the importance of reliable systems and is respected by the product manager for their judgment will be able to negotiate time to reduce their technical debt along with producing features. Creating a culture is much harder than to invent a metric and goal people against it, but is the only way to ensure metric fixation does not destroy the organization.
Over-Standardization
Decision makers often conceive of a metric and apply it as a “standard” across many groups whose work is considered to be similar for the purposes of the metric. The motivations behind standardization is to assert control (by making groups’ performance comparable to each other) and to reduce complexity (abstracting away the differences in work). We run into the pitfall of over-standardization when the metric is in fact not that standard.
Standardization of metrics almost always loses valuable local context and encourages measuring everyone with the same yardstick when their circumstances may be different. Even when leaders acknowledge that two teams are dealing with somewhat different situations, human beings being human, there is a great temptation to start a conversation with “why is your metric X much lower than that other team?” The team now needs to explain that, well, things are different. Sometimes a team may not even know about that other team’s circumstances, which makes the explanation more difficult and forces the team to clutch at straws. At best this wastes time re-explaining something that is already known; at worst, people give up trying to explain and meet the yardstick via gaming the metric.
Example. When I was working for a fast growing startup, at a certain point the (few) engineering managers could no longer be personally acquainted with all of the employees and be familiar with their work. We decided we needed a more formal performance review system with metrics. We considered a metric: number of code “commits” to our central version control system. Commits vary by task. Since everyone did the same kind of work on the same codebase, everyone should get a similar proportion of tasks, and variations should smooth themselves out over time. The number of commits therefore should reflect employee productivity. In other words, it would be a “standard” metric that could apply to everyone. I did a quick check and found that an engineer whose work I was personally familiar with and held in high regard was pushing far fewer commits than other engineers. I spoke to the engineer and discovered that the engineer had a personal workflow on his local system. He’d make several small commits locally and only when code, tests and documentation were all done, he’d clean up local commits and push a single logical commit to the central repository. In contrast, other engineers would commit code as soon as it was compiling, regardless of whether the overall task was fully completed. This engineer was, in fact, making greater efforts to help his peers and the organization. If we had adopted this metric as an input into performance ratings, we could have mis-classified a high-performing engineer to be a low performer. We abandoned this metric.
Example. My team members get work requests on an ongoing basis. The timing and nature of incoming work and associated deadlines are dependent on external customer demands and are out of our control. Often, demand outstrips supply and we have to prioritize work. We do so primarily on a first-come-first-serve basis, but do reprioritize tasks if our instinct tells us to. Last year, I decided to make prioritization more scientific and objective by creating an “impact” score for work requests. The problem? We do work of different types with different kinds of impact. Just a few examples: some tasks increase revenue (by enabling customers to use out technology), others actually reduce it (by making the customer’s system more performant and cost-effective), and some others improve the security of our customers systems (with negligible impact on revenue). In a mis-guided attempt to make different kinds of work comparable, I invented formulas to estimate their value in notional “dollars”. My team, somewhat bemusedly, went along. We found that the formulas were simultaneously complicated and highly subjective. We were spending time calculating the “impact” score, but the inputs were still our gut feel. The precise looking score was still guesswork and gut feel. We could have just stuck with gut feel. After persisting for some time to refine and use our formulas, I finally took my team’s feedback and officially abandoned this attempt to create a “standard” metric. I thank my team for giving the idea a chance but also for giving me honest feedback.
Avoiding the Pitfall. Overly-standard metrics may seem to save time by not having to discuss differences in-depth, but in effect they will create errors in the system that will lead to bad decisions and will need to be fixed later. The first remedy is that before trusting a metric to be standard, we must investigate it thoroughly by checking in with all (or a representative sample) of people who actually do the work. The second remedy is not introduce a standard at all but continue to deal with complexity as it is instead of trying to paper over it.
Pitfalls in Data Input

Faulty Data: Inadvertent Distortion of Data
Metrics that depend on humans entering data are subject to data entry errors. Some errors are one-offs (e.g., someone entered 40 instead of 4) and can be caught easily in case of glaring discrepancies. When not every error can be caught, an inspection can be done to estimate what the error rate is and account for it in future. However, some errors occur due to misinterpretation of a metric’s meaning and lead to systematic, cumulative and growing error in the metric.
Example. In my current organization, a functional group with multiple geographically dispersed teams has decided to use a particular record of work done as a standard metric across teams, with goals per team. When the metric was introduced and explained, one manager discovered his team’s past achievement on the metric was poor compared to another similar team in a different geography. He spoke to the other team’s manager to learn how their numbers were much higher and discovered they were simply recording their work in finer-grained installments than him; his team would enter one record when the overall task was started, while the other team would file a record for every “step”. This was not malicious: the other team had always done so as a local best practice, prior to adoption of this metric as a standard. The problem was that a global “standard” metric and goal was being adopted when different groups had very different interpretations of the metric, and the overall leader of the different teams had made it a standard without first attempting to standardize the interpretation.
Avoiding the Pitfall. The first remedy is to define, communicate and get feedback about the interpretability of a metric before implementing it. Getting feedback is important to detect your own blind spots. The people who actually do the work will tell us of situations where the definition is ambiguous. The second remedy is to do occasional inspection of the data to check whether the metric is really being interpreted as it was meant to be. Both of these are much work, so consider the effort before implementing the metric.
Gaming: Deliberate Distortion of Data
Donald T. Campbell, a psychologist and social scientist made a statement that is now referred to as Campbell’s Law:
The more any quantitative social indicator is used for social decision-making, the more subject it will be to corruption pressures and the more apt it will be to distort and corrupt the social processes it is intended to monitor.
When a metric-based goal is imposed on a group or individual to assert control over their work, people are tempted to “game” the metrics. The higher-stakes the goal, the greater the temptation. Due to this, the metric fails to achieve its objective of improving performance, diverts resources away from real work to meeting the goal by manipulating data, and then incurs significant additional costs in bureaucratic attempts to thwart the gaming.
Example. Campbell was writing in 1976 about a growing pressure to use student achievement tests to measure the performance of teachers and schools. Indeed, the US adopted high-stakes testing, via legislation (e.g., Bush administration’s No Child Left Behind act and Obama administration’s Race to the Top act). Teachers’ pay and schools’ funding have been tied to improvements in student test scores. This sounds reasonable, until one considers that students’ socio-economic circumstances also affect their performance in schools. There have been numerous reports of teachers and schools distorting test scores via either teaching to the test or outright cheating, because they were under pressure to survive.
Example. “Sandbagging” is a phenomenon in sales organizations where sales representatives are expected to meet goals for sales uniformly through the year, month on month or quarter after quarter. A sales person who has already met the goal for a particular quarter is tempted to slow an ongoing deal to the next quarter instead of closing it as quickly as possible, otherwise the next quarter may look poor compared to this one, inviting scrutiny and (unfair) criticism. This is not good for the customer or the organization, and serves only to satisfy the decision makers desire to run the business “smoothly”.
Avoiding the Pitfall. There is no way to avoid this pitfall if goals are high-stakes, as Campbell’s Law states. The first remedy is to not make goals high-stakes but informational. An environment where metrics are thought of providing information and not to be used to reward or punish will be one where there is less temptation to distort metrics. The second remedy, where the goal is indeed high-stakes, is to not impose the metric and goal but to motivate those who will actually do the work to adopt the goal as a mission. This is what Pronovost did in the Keystone Initiative that I wrote about above.
Pitfalls in Reporting

Most organizations, when implementing metrics and goals, start with a relatively few metrics. Starting from nothing, even a few metrics offer insights previously unavailable. Decision makers realize the power of metrics and start adding more metrics.
Initially, when the metrics are few, the decision maker is able to retrieve the metrics and create reports for themselves. More importantly, the decision maker is able to distinguish between more and less important metrics, and choose a representation or visualization that brings important aspects and comparisons out more or less clearly (depending on their skill with the reporting tools). Soon though, the volume of data and the number of metrics outgrow the ability of the decision maker to do the reporting themselves. The organization then hires resources whose job it to create reports. This leads to several pitfalls.
Too Many Metrics
Resources hired for reporting do neither the actual work behind the metrics, nor carry the responsibility of making decisions. Since their job is to report, soon reports become larger and dashboards proliferate. Seldom is a report trimmed pro-actively to remove less relevant data. Misunderstandings about the meaning of a metric and how to present it creep in. An increasing amount of time is now spent in finding the signal amidst the noise.
Example. An organization I am familiar with invested in resources for creating self-service dashboards collecting various metrics, to aid senior decision makers, middle managers and field employees. Starting with a few dashboards, the system grew as different stakeholders asked for different reports or asked for more data to be included in existing ones. Soon, there were too many dashboards to click through, and it took too much time to filter relevant data across dashboards. Now there is a system on top that captures visualizations from multiple different dashboards and creates a static weekly report with all possible information that anyone might ask for—a one size fits all approach. The report has more metrics than can be reviewed in a group meeting. What is absent is any discussion of which metrics are most relevant for discussion in a time-bound meeting.
Avoiding this Pitfall. The first remedy is to have people who do the work and make decisions do their own reporting, as long as possible. When a reporting reporting resources must be hired, the tendency of metrics and dashboards to drown the signal amidst the noise has to be compensated. The remedy for that is to allocate time to get clear on (a) how many metrics can be discussed in the time available; (b) which metrics are the most important ones; and (c) what sequence to follow when looking at them, for greatest efficiency; (d) which metric costs more in reporting and reviewing than the benefit it provides and remove it from the the agenda of the meeting.
Precise But Inaccurate Aggregates
Reports show aggregates of individual values—count, sum, average, standard deviation—as precise numbers. The problem is, some aggregates are misleading.
Example. An internet user who works in technical support writes that he has a metric of what percentage of support cases assigned to him are resolved within SLA. His bonus over basic pay is tied to the metric. If he resolves 9 cases within SLA and 1 fails SLA his metric is 90% and he gets 90% of variable pay. So far, so good? The problem is, the percentage seems to be calculated as a snapshot at certain moments in time by looking at only open cases, not based on past history. So, for e.g., yesterday he has 10 open cases, 9 within SLA, and 1 breaching SLA, and their metric was 90%. Today, he closes 5 of the tickets within SLA by doing some good work. He has now 5 tickets remaining, 4 of which are under SLA, 1 is breaching SLA, and looking only at open cases the metric has dropped to 80%. In other words, the metric might look worse even after doing good work. He explained that this is not a fair way to calculate the metric but management did not get it. Now it is against his interest to resolve cases as quickly as possible. He is incentivized to keep cases open as long as possible and resolve them just on or before the due date, so that anyone looking at their open cases anytime will see a lot of cases that have not yet exceeded SLA, reducing the proportion of those breaching SLA.
A more accurate metric would be to look at both open and closed cases over a period of time, say last 12 months, and determine what percentage of them were closed within SLA. This calculation is a bit more complex and costly as it requires doing business logic on historical data. Most self-service BI tools do not make it easy or even possible to do this calculation. It is far easier to do calculation only for open tickets. Easy and precise but inaccurate and unfair.
Avoiding the Pitfall. When using metrics to measure human performance, accuracy, i.e. measuring something that is a fair representation of work or results, is very important. An approximation that looks “good enough” to decision makers may have a devastating impact on those doing the work. If you are going to measure humans with metrics, accepting limitations in measurement, when we are not accepting limitations of the human, is just unfair. To be sure you are being accurate instead of just precise, explain the metric to those who will be measured by it in great detail, and get candid feedback from them, before implementing the metric.
Wasting Time Discussing Normal Variance
Many reports contrast the metric against expected achievement against target, and some call out variances in the metric over time. Often, metrics are helpfully colored green (on-track or better than target), yellow (at risk) and red (off track; needs intervention). Red and Yellow colored metrics attract attention and invite questions and discussion. A significant amount of time is consumed this way. Are the reports bringing attention to things deserving the most attention?
When it comes to human work with many variables, some variance in metrics is inevitable and even expected. Let’s call this “normal variance”. Variation beyond this boundary might be indicative of a problem, and let’s call that “significant variance”. Who decides the boundaries between normal and significant variance?
I can tell you who does not decide the boundaries in most organizations: people who do the work.
The people who decide these ranges are usually dedicated operations specialists who look at historical data, multiple geographies, customer segments, functions etc. to come up with an educated (we hope) guess about what deviations should be highlighted for discussion. The ranges are usually set to be the same for “similar” groups and individuals. This is over-standardization at work.
However, in reality, most of the time, standardized deviations are not well tailored to any particular group.
Example. The US Air Force found that by designing aircraft cockpits according to “average” dimensions of pilots, they were causing crashes (highlights mine):
Back in 1926, when the army was designing its first-ever cockpit, engineers had measured the physical dimensions of hundreds of male pilots (the possibility of female pilots was never a serious consideration), and used this data to standardize the dimensions of the cockpit.
… Using the size data he had gathered from 4,063 pilots, [a researcher] calculated the average of the 10 physical dimensions believed to be most relevant for design, including height, chest circumference and sleeve length. These formed the dimensions of the “average pilot,” which [the researcher] generously defined as someone whose measurements were within the middle 30 per cent of the range of values for each dimension. … Next, [the researcher] compared each individual pilot, one by one, to the average pilot.
… the consensus among his fellow air force researchers was that the vast majority of pilots would be within the average range on most dimensions. After all, these pilots had already been pre-selected because they appeared to be average sized. … But even [the researcher] was stunned when he tabulated the actual number.
Zero.
Out of 4,063 pilots, not a single airman fit within the average range on all 10 dimensions.
Now compare this to the less lethal business of deciding how someone or some group is performing. Each group will have a set of metrics. Like US Air Force pilots, there is no group which is going to be “on-track” across all metrics. Almost every group will have some metric that is flagged for attention, but that is actually within normal variance for their specific business. Decision makers will want to discuss those metrics, and will spend a lot of time discussing what is normal variance. It gets worse. Let’s say, last month, some group has explained already that a particular deviation is normal. In the current month’s report, their metric is flagged again. Most reports do not carry over the explanation from last month. If the decision makers remember the explanation, good, but if they don’t…
By the way, have you noticed that almost no report highlights exceptional performance versus “just” good performance. They are both colored the same way: green. Why is exceptional performance not highlighted (I propose purple)? If we spend time discussing problems, we could usefully also spend time learning something from exceptional performers. Yet, reports call attention to problems but not opportunities. It is up to the meeting attendees to notice this and discuss it. One explanation is that exceptionally good performance is rare, and the reporting professionals may not find it a good use of time to do the work to highlight it. Another explanation is that it has something to do with the underlying motivation: keeping the people who do the work under control, not necessarily learning from data.
Avoiding the Pitfall. If you are setting up a reporting organization, make their purpose clear to them and everyone else; and the purpose should be using reports to help the business improve, iteratively, based on data. Don’t measure their performance by how many reports they have produced. Ensure the reporting organization is accountable to the people whose performance they are measuring and not just to senior leaders who are far from the work. Be wary of over-standardization. Be especially wary of aggregates or calculations that have not been well-documented. If the reporting organization is not taking responsibility for explaining their impositions then it is time to explain to them where their primary accountability lies: to improve the business, and not to keep professionals under checks.
Pitfalls in Interpreting Metrics

Over-Simplified Metrics
In a bid to compress information into a simple to understand metric, we lose a lot of information that is critical to good decision making. They can lead to incorrect decisions.
Example. I am going to present an analogy, but it is based on a real incident. An imaginary company, Parijat’s Home Supplies has stores in cities across the country, in many neighborhoods in each city. Every store manager is given a sales quota for the year, projected largely on last year’s sales. In 2019, a store in Small Town near Upscale Neighborhood did very well, due to a new mansion being constructed there ramping up demand. Next, the store manager was given a hefty increase in sales quota based on last year’s growing sales trend. The manager protested that the mansion’s construction is nearly complete and no new mansions are planned, and this year’s sales will be nowhere near last year’s. The executives in Mega City, far from the neighborhood, did not see the memo because it was buried in a pile of similar calls for adjustments of sales quotas from managers across the country. The decision was final, based on a simple metric. The store manager worked extra hard, but did not meet the sales quota and had to forgo his bonus.
Avoiding the Pitfall. The first remedy is to be suspicious of simplified metrics and ask if they are providing you with the right information. The second remedy is to not make decisions based on metrics with limited accuracy without a deeper investigation.
Knee-jerk “Improvement”
When a metric is used across a number of groups or individuals, and reviewed across them, there is an implicit performance comparison and hence competitive pressure. The pressure leads to the explicit or implicit question: “how do we improve this metric?” Sometimes, the metric should not be improved. It should be just what it is. Or, it should change, not in comparison to other groups, but on its own. Repeated comparison embarrasses groups with low numbers for their metric, and forces them into changing something to the detriment of their mission just to avoid the embarrassment.
Example. In his book, The Delicate Art of Bureaucracy, Mark Schwartz recounts an experience of the pressure to “improve” a metric. Schwartz works in a group that publishes articles on an official company blog for senior enterprise executives. This blog is one of many, each on different themes targeting different audiences. A report on viewership indicated that Schwartz’s blog was (only) the 18th most viewed blog. Someone asked what the group intended to so about it. The assumption was that since there is a metric, it must be improved. Schwartz’s group, which actually did the work, did not see things that way. The audience for their blog was a narrow one. It was justified that there would not as many viewers compared to other blogs that catered to larger audiences. Trying to make the blog more popular by writing articles that appealed to more people but at the cost of being less appealing to its specific audience would cause the blog would lose its purpose. The metric and comparison created pressure to create a false “improvement”.
Avoiding the Pitfall. Knee-jerk reactions are a side-effect of over-simplification and over-standardization. The first remedy is to not present metrics in a way that compares groups. Note that it is extremely tempting to do so, when the groups seem to be similar. If you do compare two groups for performance based on metrics, do the comparison privately, and then dive deeper into the circumstances of each group: What are they doing? What are they doing differently from the other group? How do their circumstances differ? This is a fair amount of work, and is much harder than just telling the groups “this is how you compare to each other. Lower performing group: pull up your socks.” If you don’t do this this extra work, you will create an environment where people will try to beat metrics rather than focusing on doing good work.
Pitfalls in Making Decisions

Decision-makers, at the end of the day, need to make decisions. Giving groups and individuals feedback on performance is itself a decision (what feedback to give). Other decisions are about setting goals, structuring the organization, deciding what work should or should not be done. There are numerous exhortations for organizations to make data-driven decisions (examples: 1, 2). I am not arguing against using data to make better decisions. I am arguing against making decisions based purely on quantitative metrics.
Ignoring Non-Metric Data
There’s more to reality than that is captured by metrics. The McNamara fallacy (also known as the quantitative fallacy), named for Robert McNamara, the US Secretary of Defense from 1961 to 1968, involves making a decision based solely on quantitative observations (or metrics) and ignoring all others. It proceeds like this: Measure whatever can be easily measured. Disregard that which cannot be measured easily. Presume that which cannot be measured easily is not important. Presume that which cannot be measured easily does not exist.
Example. A well-known company in my corner of the world decided to build a new product. The company chose to outsource the development, setup and operations. They invited bids from vendors. Following their established procedures, they asked the bidding vendors to include several data points along with their technical proposals: their financial strength, their track record (past projects done of a similar nature), and of course, the price. I was not privy to the decision making process, but was somewhat surprised when the contract was awarded to a vendor that, in my opinion, had no past track record and no demonstrable capability in some critical technologies. Eight months later, the project is in trouble with many operational issues. In between, my team and I tried to advise and help the vendor in an effort to get them to succeed. We discovered they lacked basic knowledge and skills required to implement many aspects of the project. Weren’t they supposed to have been selected based on, partially, past track record? When I quizzed them on their past experience, it appeared that the past projects they had referenced had very superficial use of the relevant technologies. My conclusion from this is that the bid was awarded on the basis of the quantitative metrics: price being the most important one of course, but also the number of past projects referenced. The evaluation (evidently) ignored the quality of the projects done. The awarding company effectively ignored the data that could not be quantified, and pretended it did not matter or did not exist.
Avoiding the Pitfall. Being aware of the pitfall is the first step to a remedy. Then ensure that non-metric data is being captured and the people providing the data are acknowledged and appreciated. In reviews and decision-making meetings, explicitly ask for anecdotes that contradict the story the metrics are telling you. Look deeply when anecdotes and metrics disagree: you may be missing something that is not measured.
Rewarding Luck
In most human endeavors, there are factors outside our control that have a large impact on outcomes. These factors are usually not measured. When one rewards people solely on the basis of measured outputs or outcomes, and disregards effort, one is essentially rewarding luck to the extent external factors contributed to the metrics. When one rewards luck, it incentivizes people to improve their luck, by avoiding work with uncontrollable factors, even if that work is essential. Put another way, one incentivizes opportunism, to grasp favorable opportunities. A business can lose the best use of talent this way.
Example. Sales were particularly good one year in an organization. Management expanded the sales team and set aggressive sales targets for the next year. An old hand salesperson knew some of his success the previous year was attributed to a lot of uncontrollable factors going his way. This salesperson was actually really good, and had “cracked” difficult deals in the past. The best use of his talent would have been to get him to take on the hardest segments of the market. However, the salesperson knew he’d be rewarded only for (quantitative) results, not effort or ingenuity, and also that expectations from him would be higher due to past results regardless of the external factors. Since he knew the market better than the new joiners, he picked the least risky customers and prospects for the new year. He convinced management that his picks was not unusually favorable to him, partially using his past good performance and resulting goodwill, and partially because he knew the market better than management who had to believe his explanations for his choices. The new salespersons got the harder segments of the market. In the new year, the salesperson met his targets almost effortlessly, while the other salespersons struggled, and got increasingly demoralized. Ironically, the experienced salesperson met the required results in the new year early and easily, got bored, and left the company for a more challenging venture—he setup his own company. He told me he found it more fulfilling, as he was now judging himself on his own efforts with the quantitative results being secondary.
Avoiding the Pitfall. To avoid this pitfall, you need to not “over-interpret” quantitative results. One way to do this is to look at performance against results over a longer term that is less susceptible to temporary luck. However, luck can still not be ruled out. Hence, judge people’s performance by understanding their effort and the difficulty of the circumstances. This requires “qualitative” reasoning and is both subjective and takes greater effort than just looking at metrics. However, this effort is essential, if we are to reward people and not luck. There are ways to counter subjectivity other than using metrics.
Punishing Good Performers Due to a Few Bad Actors
Organizations often implement new controls and processes in response to a few bad actors. Implementing metric-based performance evaluations is a specific way of implementing controls and processes. Sometimes, this is justified. In large organizations, “slackers” can hide in the crowd as long as the overall group is performing well. Implementing a metric to measure performance even partially is a relatively low cost way of finding out the least performing individuals and encouraging them to improve their performance or leave the organization. Of course, the metric should not be easily falsifiable. Slackers can go to great lengths to avoid work, including putting in more work into hiding the fact that they are not doing work.
However, metrics are useful only to find the outliers. They are not effective for making fine-grained distinctions accurately between good performers, due to all the factors I’ve mentioned earlier. The trouble is, once an organization starts using metrics to judge performance and eliminates a few bad apples, it becomes addicted to using them more and more, and gradually replaces other forms of judging performance with metrics.
Avoiding the Pitfall. In might be unavoidable to institute a few metrics to find “slackers”. It may actually be necessary to have such data to satisfy national laws protecting employees against arbitrary and unfair dismissal. However, know that metrics are the beginning of an investigation, not the final word. Understand the motivation behind such a metric and keep them lightweight on the good performers.
Dehumanizing and Demotivating
People are complex and work they do is multi-dimensional. Good performance evaluation and management systems look at multiple dimensions, but if they convert the evaluations to a numeric score (a metric), then the evaluations become demotivating. Assigning a score to any dimension is subjective, to start with. However, some organizations seem to like the illusory objectivity of having a numeric quantity and enforce this in their performance management systems.
Example. In my first job (at a publicly funded research institute), my performance was presented as a set of scores between 1 and 5 (fractions allowed) on several dimensions, and an overall “weighted” score. The immediate question I had was why a particular score was 3.5? What could I do to make it higher? The answer was that I was doing well given the circumstances and that next year I might do better (i.e. things outside my control would allow me to score higher). I’d have been happier to have learnt that “you are doing okay, but here are some areas to improve upon”. The score’s sole purpose was to satisfy some bureaucrat that they had a good “objective” performance measurement system in place. Its effect was to create confusion and demotivate people. I’d go further and say that it probably dehumanizes managers as well, who are forced to convert imprecise judgments of performance (“below expectations”, “on track”, “above expectations”) to a number. I’ve not had to do it so cannot be certain but I think this forces managers to spend time agonizing about the number more than giving employees qualitative but valuable feedback.
Avoiding the Pitfall. Easy: don’t create a numeric metric for employee performance. Save the time that would have been spent on trying to assign numbers to performance and then explaining/defending them, and spend that time instead towards honest discussion of what good performance looks like, on why an employee is not performing well and what can we do to help, and on how to help good employees become great.
Setting Targets from Bad Data
One decision that decision makers make is to give employees some targets or hard goals. Metric-fixated decision makers set numeric targets for some metrics. Numeric targets are easy to measure against and give clarity to employees on how they are going to be judged. However, sometimes there is not enough data to decide what a good target should be. This happens when the organization decides to do something new, for which historical data is not available. In other cases, there is plenty of past data on performance but little to none about various contributing factors.
Due to these reasons, targets are largely guesswork. If a target has been set too low, there is a risk of complacency. By setting a low, reasonable target, organizations can inadvertently incentivize people not to achieve the best possible results. If a target has been set too high, people will protest that it is unfair, and if people see that despite best efforts they won’t be able to meet it, they will be demoralized. If the target is a high-stakes goal as well, people will try to game the metric or look for employment elsewhere.
Why set numeric targets when it is not clear what it should look like? One argument is that if there is no target at all, that aspect of work will get no attention and will not get worked on. Targets are needed to hold people accountable, the thinking goes. However, a target imposed on people, especially then there is no supporting data, is unlikely to motivate people. At best, people may accept the target with resignation, and not look at creative ways to do the best work possible. At worst, people may game the target.
There is one exception: setting a moonshot target. A good moonshot target is audacious, and yet the people doing the work are highly motivated. They understand that they may not achieve the target but are going to do their best. The motivation comes from (a) the reasoning behind the initiative being clear; (b) the target being a low-stakes one—no one will be punished if they did their best but failed to meet the target; (c) intrinsic motivation to participate in the initiative.
Example. I have a target for one kind of activity that my team does. Let’s call it “frobnication”. Frobnication requires a certain amount of experience to do. We also cannot do the activity on our own, and depend on other teams to create an opportunity for us to frobnicate. The target I got this year was my team’s strength multiplied by a per-person average target. The per-person average target was a multiple of last year’s target. The rationale for this was that we achieved our target last year easily, so let’s make the target a bit more challenging. I have several problems with this: (a) per-person: we may have done well last year, but frobnication takes effort, and there is no evidence that we have the time to do several multiples of what we did last year; (b) per-person: while my team has grown, half the members are new and not quite ready to frobnicate right now; (c) overall: I am unsure that there are enough opportunities for my team to frobnicate as many times as our target demands. The result is that this target is challenging in a demotivating manner, not an inspiring manner. What used to be a fun and valuable thing to do has been turned into a burden, where I expect to have to explain why the target is not being met, without any means at my disposal to achieve the target.
Avoiding the Pitfall. As we saw in the description of the Keystone Initiative, change comes from intrinsic motivation. A target is not required—a simple metric will do. The metric is used to communicate and inform, not hold people “accountable”. However, in this mode of working, the pre-requisite is that people are motivated. This requires explaining the value of the new initiative and getting buy-in. Once practitioners are convinced, they will adopt metrics as a directional sign-post, and try to do their best on improving the metric without gaming the system or compromising on aspects of work that are important but not measured by a metric.
Pitfalls in Changing Work
Metrics, targets and goals are meant to change people’s behavior, and the work they do. When people change what they do based on external goals and not intrinsic motivation, many things can go wrong.
Goal displacement
Goal displacement or surrogation is the phenomenon where people start working to meet a metric as target, instead of the underlying intent. This can have devastating consequences.
Example. In an article from 2019 in the Harvard Business Review, titled Don’t Let Metrics Undermine Your Business, the authors describe an extreme example of the consequences of surrogation at Wells Fargo bank. This is my summary of what happened: Wells Fargo had and continues to have a strategy of building long-term retail banking relationships with customers. They already had a metric for cross-selling activities. Wells-Fargo decided to align the metric with the strategy. Unfortunately, employees started acting, at a large scale and over a long period of time, as if cross-selling itself was the strategy as opposed to long-term customer relationships. There was immense pressure on managers and employees to meet the metric’s targets. To meet this non-existent “strategic goal”, employees fraudulently opened millions of deposit and credit accounts without customer consent. For some reason, managers and senior leaders did not detect that the increasing number of accounts from so-called “cross-selling” were created in a fraudulent manner. Initially, when some customer complained about fees and charges related to accounts they had never consented to creating, or unexpected credit cards and mortgages they did not sign up to, the incidents were blamed on a few, over-zealous employees; no one thought to check whether this was a wide-spread occurrence. Since the misbehavior came to light, Wells Fargo has had to spend billions on reimbursing customers, paying damages and fines, and for litigation. Regulators stopped them from growing their assets for a while (meaning, Wells Fargo could not get new business, even legitimately, while they continued to pay damages and fines). And, besides losing money, the bank has also lost customer trust: the issue came to light in 2016, and the bank is reporting a fall in new customer sign-ups even in 2021. The damage to the bank has been extensive and persistent.
The authors examine the underlying causes and conclude that the root cause was a pervasive culture of measuring performance by metrics. They wrote:
The mental tendency to replace strategy with metrics can destroy company value.
Perhaps this is an isolated case? No. Muller, Schwartz, and legions on the internet give many examples of metrics replacing the actual goal, as far as people’s behavior is concerned.
Avoiding the Pitfall. The remedy is to not have high-stakes goals in the first place, supported by carefully looking at non-metric signals and investigating them.
Ignoring Work That is Hard to Measure
When people know their performance is going to be evaluated via metrics, and only or very largely via metrics, the following applies:
Work that produces measurable outcomes tends to drive out work that produces unmeasurable outcomes. — James Q. Wilson, Bureaucracy.
Example. The mission of a Customer Service (CS) department is to resolve customer issues. CS departments cost a company money and don’t generate revenue. Most CS departments are under pressure to reduce cost by maximizing the number of calls handled by each CS agent. Many CS departments have a metric for “call duration”—the amount of time CS agents spend on the phone resolving a customer’s problem. Agents’ performance is measured by the average duration of calls, lower the better. Agents were therefore incentivized to follow checklists and flowcharts, and declare a customer issues solved as soon as they had followed a sequence of steps, regardless of whether the customer’s problem was actually solved or not. Agents avoided doing anything extra, even if the checklists were incomplete. Until a decade ago, most CS departments did not have compensating metrics like customer satisfaction. Most companies had a bad reputation for their customer service.
Avoiding the Pitfall. Don’t have high-stakes goals or metrics that are tied strongly to rewards. If you must have them, then have a set of compensating metrics to keep bad behavior in check. Compensating metrics can check bad behavior to an extent but not completely, and cannot foster creativity and passion.
Creaming
Groups that have high-stakes metrics will make efforts to not do work that may lead to their metrics being negatively impacted, even if that work is of value.
Example. A growing number of healthcare institutions and physicians in the US are compensated on their “success rate”. High levels of “adverse patient outcomes” (example, proportion of patients admitted dying) lead to lower physician and hospital ranking, withholding of government funding, and even lowered physician salaries. Net result: physicians and hospitals simply decline to admit patients they deem to be risky—i.e., those who will die even if the physician puts in their best efforts. Since there is no metric for how hard the physician tried or how improbable was it for them to succeed, a physician who cares for everyone regardless of their prognosis will suffer. A physician who declines to handle patients whose condition is challenging will seem to be more successful.
Avoiding the Pitfall. You cannot prevent creaming, as long as there is a metric that measures outcomes but not the various kinds of inputs or circumstances. Imperfections in measuring the different circumstances snowball into large disincentives. The remedy is not have high-stakes metrics in the first place.
Promoting Short-Term Thinking
Metrics and goals measure things over a period of time. If people are not recognized in some way for work whose results will not appear in that period, people are disincentivized to do that work.
Example. There is an ongoing debate about executive compensations. One question is whether CEOs are paid too much. But another, important one, is whether CEOs are compensated on short-term results or longer term ones? A particular criticism is that CEOs are compensation (partly) on the basis of stock options that vest in the short term (a year or two). The stock-price of a company is a metric, with high-stakes. CEOs are therefore incentivized to take risks to increase the value of the company’s stock in the short term, ignoring negative consequences in the long term. Once the stock vests or is exercised, the CEO sells the stock, and then stops caring if the stock falls. Well, they probably do care, as it reflects on their own performance, but they probably care less about it than making money now.
Avoiding the Pitfall. Long term thinking in the course of work is more about how work is done than what work is done. The what changes frequently. For example, a software development team, in the short term, is interested in developing products and features. Non-visible aspects like reliability and security also require work, usually over a longer period of time than feature deadlines and release milestones. The team that does the work is able to see mounting technical debt earlier than management can. The need to do work to reduce technical debt does not become an official project until it is already having a large negative impact.Teams should call out opportunities to reduce technical debt, weigh the costs and benefits, and undertake this work as part of ongoing project work. It would be hard to incentivize this through performance metrics. It is better to incentivize this by building high standards of technical work into the value system and culture of the organization.
Dis-incentivizing Innovation
Imagine a group whose performance is measured soundly and comprehensively through metrics. Imagine they are doing planned work well, and their metrics are all green. Now imagine they see an opportunity to do some unforeseen, new and innovative. This could make a disproportionate positive impact to the organization. But it would require stopping or delaying some planned work, which would impact some metrics. The group could propose the new project and negotiate their metrics with management. In most hierarchical organizations, the negotiation would flow upwards and when there is more than one level, this takes much effort and time. Especially time. The group may lose interest and their initial enthusiasm by the time everything has been worked out. Most likely, however, they’ll be told that the metrics stay as they are they need to do the new project on a best effort basis until the next budget cycle.
Example. Organizations hold “innovation” weeks or days, or “Hackathons” to overcome the inertia of their groups. For a few days, the organization gives permission to employees to not care about their metrics (and get managers off their backs) and do something new. A few projects are blessed by management for pursuing further. For the rest, things quickly go back to normal afterwards. What if employees had a way to innovate any day, every day, whenever there was some worthwhile innovation to do?
Avoiding the Pitfall. Metrics and targets need to be low-stakes, and people at all levels need some flexibility in making decisions about their targets. Only then can local innovation flourish. This is not to say that innovation projects should not be reviewed and held to high standards. However, that review should be flexible enough to work outside existing metrics.
Undertaking Non-value Generating Work
In a metric-fixated organization, much work is undertaken purely to improve metrics, and not because it is of value to anyone. Metrics that look “green” could be due to useless work.
Example. International and national university rankings have been shows to have very little impact on student choice. It has more impact on funding of university programs and research by funding bodies. One factor in rankings is a rating by peers. Administrators of universities are asked to rank other universities on various dimensions. The problem is, these administrators actually know very little about the other universities, and therefore the ratings are based not on knowledge but how often an administrator may have heard of the other university. As a result, some universities are taking out expensive, full-page advertisements in magazines and journals targeted at university administrators. The advertisements talk about the university’s research record and other aspects that are of no interest to administrators at other universities, but are placed there purely to increase the awareness of the advertising entity’s name. An unknown but sizable amount of money is spent this way. It is not increasing the quality of education, research or campus facilities, or lowering tuition fees. Its sole purpose is to increase the university’s ranking.
Avoiding the Pitfall. The remedy is to first create a culture of blameless postmortems, and then extend their use from examining things that went wrong to also things that are going right. Periodically, do a blameless postmortem of “green” metrics. Ask: (a) what did we do to improve the metric? (b) did that work serve our organizational mission and desired outcomes? If you mind work that is not relevant to outcomes, accept that this happened because we are human beings and don’t blame or criticize. With the group, find how the metric be adjusted so that it measures only useful work. If it does not measure useful work directly, eliminate it.
Pitfalls of Cost
Implementing metrics is not free. They cost in terms of time and resources. If organizations implement metrics without looking at their costs, they are making sub-optimal decisions.
Dedicated Systems and Resources
Gathering, verifying, and reporting on metrics can become a significant task and several organizations set up dedicated systems and teams to do so. These costs are figure on a balance sheet somewhere, but it is rare for these costs to be compared side-by-side relative to the benefit of the metrics. It is assumed that the benefits outweigh the cost. This is puzzling, as these same organizations require business cases with detailed cost-benefit analysis to start new projects, and ongoing reporting of cost for business units, projects, products etc. to ensure they make sense.
Sometimes the costs, when reviewed, are shocking.
Example. The US’ No Child Left Behind Act enacted in 2001 envisaged lots of performance metrics (many left to individual states to define and implement) and created a bureaucratic and administrative burden at all levels of the government. This cost was not estimated as part of the act. The Heritage Foundation, an American conservative think tank, reported in 2007 that:
No Child Left Behind created new rules and regulations for schools and significantly increased compliance costs for state and local governments. According to the Office of Management and Budget, No Child Left Behind increased state and local governments’ annual paperwork burden by 6,680,334 hours, at an estimated cost of $141 million dollars.
Here is an additional, insightful observation about costs outweighing the benefits:
In other words, the federal government was the cause of 41 percent of the administrative burden at the state level despite providing just 7 percent of overall education funding.
Avoiding the Pitfall. The pitfall occurs because the cost of reporting and compliance is reported separately, as a budget of a specialist reporting organization, and not presented and reviewed side by side with the initiatives they are supposed to support. The remedy therefore is to attribute reporting costs by initiative (which by itself is an additional cost), and to review the cost of reporting. Then ask: is it worth it? Is it better to reduce administrative costs drastically by reducing precision?
Hidden Cost of Time
Most metric regimes require the people doing the work to do extra data entry and even some reporting. When metrics and targets don’t agree, groups are required to do more reporting to explain the deviations. All this takes time. How much time? This is usually not measured. Senior decision makers think that the additional time required is negligible. “It takes only 2 minutes” is a common refrain. How do they know? Have they asked, shadowed someone doing the work, or done some other kind of study? Well, another refrain is “death by a thousand cuts”. Do decision makers know all the “2 minutes” their employees are spending on reporting and administration?
There are two important questions. First, how much time is being spent on data entry? Second, is this acceptable? While the first question is tedious, it can be answered by studying a representative sample of users for a period of time and is a one-time effort. The second question is essentially: what is the value of the information being captured and is it higher than the cost of capturing the information? As far as information is going to be used to make an economic decision, its value can be determined using a field of mathematics called “decision theory”, an offshoot of game theory (see How to Measure Anything, Chapter 7).
Avoiding the Pitfall. The first remedy is to know if there is a problem. If you have a large organization, implement regular “health of the organization” surveys. THe survey should be holistic, not just about metrics. Source survey questions not just from decision makers, but employees themselves: what issues are they thinking about? Is this an organization wide issue? And then ask about administrative burden. One of the factors will be the time spent in metrics. Use this to get a sense of the organizational cost of metrics and also to check if some group is particularly burdened. The second remedy is to ask before implementing a metric: how much time and effort will this take? Don’t think of a lone employee doing 5 minutes of extra data entry but whether the total cost across the organization is worth it.
Conclusion
Metrics are a seductive way of making judging human performance. Most ways of using metrics have pitfalls. We looked at the lifecycle of a metric systematically and identified pitfalls in each part, and how to potentially avoid them. The list is very long, and there is no point in trying to remember it. What is more revealing is the motivation behind the metrics. If there is just one thing to take away from this article, it is this: the only useful way of implementing a metric to judge performance is when a group or team believes in a mission and comes up with the metric themselves or understands deeply, agrees with, and knows the cost of a metric invented by someone else. If metrics are not backed by intrinsic motivation to improve things, they will backfire.